Showing posts with label Oil Technical Analysis. Show all posts

Tuesday, 11 June 2013

WTI crude technical analysis: how will prices react to tomorrows EIA inventories report?

Tonight’s industry-backed API crude inventory report showed US domestic crude stocks increased a staggering 8.97 million barrels, way above the estimate of a 0.5 million rise predicted by a Bloomberg survey.  Following the announcement, WTI prices declined by approximately $0.5, although had risen by nearly $0.8 in the two hours before the announcement. With tomorrow’s EIA report likely to show a similar rise in stocks, and markets trading down today due to the Bank of Japan refraining from adding additional stimulus, do the technical support the view that crude could fall further?

On the daily chart below we have three indicators shown; Bollinger bands, the MACD and the William %R. At the moment neither the MACD or William %R have cross into selling territory, as we would expect the green MACD line to cross the red signal line or the zero line and the W%R to cross below -50. As we can see from the latest candlestick on the daily chart, the reason for these both remaining some strength is that the WTI crude price rebounded from its earlier low of $94 to its current level of $94.86. Given the rebound happened before the much higher than expected rise in inventories, we can gather some clues from the higher frequency charts as to whether the price may decline further tomorrow.


On the 30-minute chart below, the same three indicators show that crude is also testing its 30 minute middle-Bollinger band (the 20-day MA), the MACD lines are in a similar place to the daily chart and while the W%R has already crossed below the -50 mark.
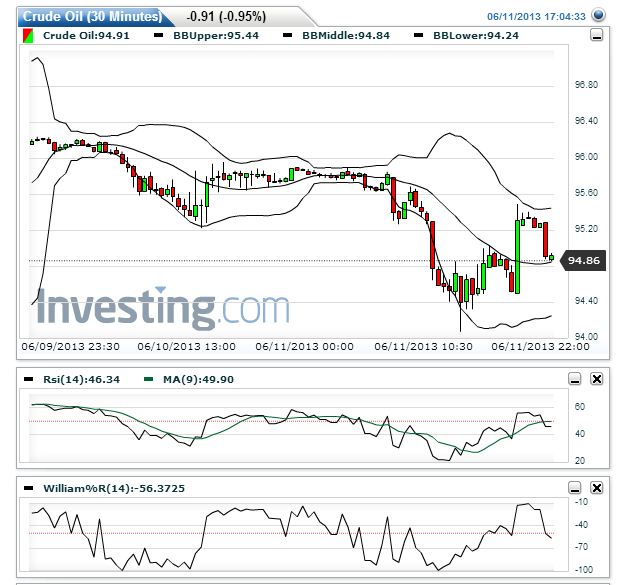


With both charts testing typical support areas, the MACDs approaching a potential cross-over selling signal and the W%R of the higher frequency already giving a sell signal, signs are strong that WTI has the potential to carry on falling further if economic sentiment remains bearish tomorrow. However, traders looking to go short should wait until a full set of signals are received. On the higher frequency charts, resistance areas can be seen at around $94.5-94.4. If this boundary is breached, we should expect to see WTI fall to the $94 boundary, which marks both the 20 and 200 day MA. 

Tuesday, 4 June 2013

WTI Crude Technical Analysis: Further to fall?

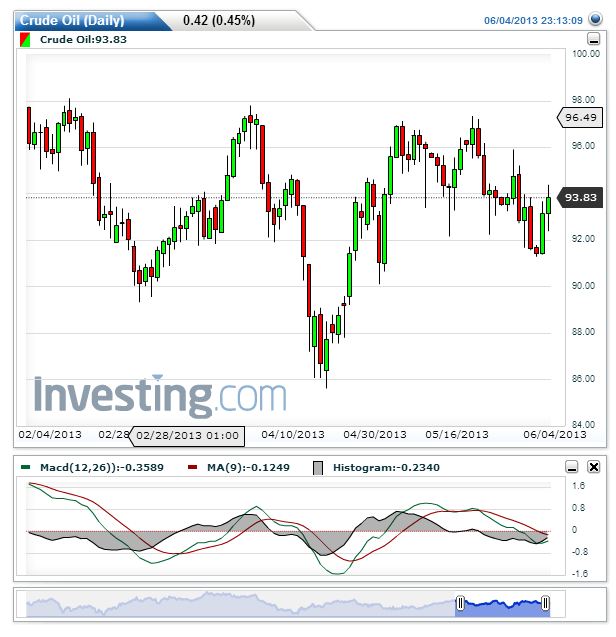
WTI has trended downward from a high of $96.8 on 20th May to reach as low as $91.20 at the start of the week, before rebounding back up to where it currently sits at $93.8. While the grade saw some strength in the last couple of days, the question we need to answer is whether this is a rebound from technical resistance that will result in an upward trend, or whether the grade is destined to fall further over the coming days. To answer this question, let’s look at some of the technical indicators.

Firstly, two oscillating indicators, the MACD and Williams %R both give slightly bearish signals on the daily chart. In terms of the MACD as shown below, there was a signal crossover back at the fall from the peak price on the 21st, while a zero-line downward cross was seen at the middle of last week. Both predicted the trend over the following days well, and both remain in bearish territory, albeit with the MACD showing some sign that it could cross the signal line if positive momentum continues.


The Williams %R below shows similar signs, with the indicator having made a bearish cross back on the 22nd May when it fell below the -50 mark, before falling deep into oversold territory on Friday 31st May. Such oversold signs could go to explain the current rebound, in which the indicator is yet to test either the -50 mark or the overbought area at -20 and above and hence remains somewhat inconclusive.


Importantly though, Bollinger band patterns appear to be showing an “M top” pattern, in which the WTI grade failed to reach the upper Bollinger band on either of its last two high-points, with the second point diverging further than the first. This was followed by a strong cross of the middle-band and the crossing of previous support, with the grade settling below its lower band on two occasions in the last four sessions, showing the strength of the bearish momentum and suggesting that the latest rebound could be a slight correction on a downward trend rather than the reversal of that trend.


Trade Recommendation


With tomorrow the day for the weekly EIA report, the results will be the perfect opportunity for bears to grapple with the bulls and determine whether this downward trend for WTI will continue. I believe such an outcome is likely, and unless WTI shows signs of breaking above the $94, or if the grade does break above but then falls back strongly, then I suggest selling WTI with a target of  $92-$91.5. 

Thursday, 23 May 2013

Brent and WTI technical analysis: Waiting for a trend form?


As the charts below shows, Brent and WTI have both been trading in a range since the beginning of May, with the North Sea grade ranging between $101-$105 and the US grade trading between $92 and $97.


A variety of factors have contributed to the sideways motion, but above all markets are locked in a battle of sentiment, with negative economic news one day balancing out against positive signs the other. Importantly however, technical analysis shows that if we are about to embark on another trend, then we could be looking at a strong bullish one.

The reason for this is that the lower Bollinger band has combined with the lower support area to form a very strong area of support that could form the lowest point of the next upward trend. What’s more, today both WTI and Brent dropped below these respective areas but climbed straight back up, unable to closer below them, thereby confirming the support areas as the charts below show.


It could be a few days before we confirm a possible upward trend, but the moving average indicators could be the key to demonstrating the upward move. At the moment on both the Brent and WTI charts above we see that the 10-day moving average (MA) has been mostly steady over the last week, with the 5-day oscillating above and below, confirming the range-trending scenario. Thus if we’re to see Brent and WTI break out into an upward trend then the first key signs will be for the 5-day to maintain its current position above the 10-day MA, and for the 10-day MA to lift itself away from its current position on both graphs, that is above and beyond the 20-day (the middle Bollinger band).  

Wednesday, 20 February 2013

Technical Update: Brent Crude: Hanging man indicates a correction


Brent has been on an upward trend for weeks, but has slipped in recent days after touching $199.17 on 8th February.

As the chart below shows, technical analysis based on data from the end of the day yesterday indicated Brent could be heading for a reversal, in a similar fashion to the technical post on WTI yesterday.


Firstly, we can see a pronounced “Hanging man” formation on the 15th, when the within-day price fell $1.7 from opening to reach a low of $116.3, before closing back at $117.7. The formation shows that while there were buyers in the markets, they did not have enough power to completely overwhelm the bearish sentiment. What’s more, a similar pattern was seen yesterday when the grade closed at $117.52, slightly up on the open, but tested the waters as low as $116.56.

In addition to these signs, the technical MACD indicator provides a bearish confirmation; as the lower section of the chart shows, the MACD line has crossed over the signal line, indicating momentum may now be entering a bearish trend.

Indeed, in trading today we have seen a large fall in oil markets, with WTI falling $2 and Brent dropping $1.9. However there have been two fundamental reasons contributed to this fall; Bloomberg suggests a hedge fund liquidating its overall position caused a large sell-off, and with the March contract expiring today a rolling over to April contracts resulted in the March price dropping further.

While there seem to be fundamental reasons for the fall seen today in both WTI and Brent, it will be interesting if the fact that these drops have confirmed the signals discussed in Brent above, and in the WTI post yesterday, will result in prices of the two grades developing as predicted, which we’ll review at the weekend.

Tuesday, 19 February 2013

Technical Update: WTI; Reversing from a Double Top?

WTI has been on a clear uptrend since early December, when the price of the April 2013 contract experienced a low of $86.57 before beginning its upward march, increasing to a high of $98.65 on 30th January. Now we’re seeing a pattern formation that could mean the end to this rally; a Double Top Reversal (a good explanation of this technical indicator can be found at stockcharts.com).


As the chart shows, the peak of $98.65 has been followed by a trough with a low of $95.37 on 11th February, before rebounding back to the previous peak and touching $98.52 on 13th. With the last four days exhibiting a downward movement back towards the trough resistance level, we could see confirmation of the Double Top Reversal, and thus of a downward trend, if the price falls through the $95.37 level.

To give a better indication of whether the Double Top Reversal is forming, we can look at some details of the underlying volume. One of the key points is trading volumes; the price increases seen as WTI approaches the second peak should be characterised by low volume, demonstrating a lack of market interest in a further rally, while the decline from the second peak should be characterised by higher volumes as bears begin to overwhelm the remaining bulls.

Indeed, as the volume indicators on the chart below shows, if we compare one-day volume with the 25-day MA, we see there was indeed a decline in trading on the second ascent. On the other hand, while volume did pick up slightly for the first major decline on Friday, trading on Monday and Tuesday was low due to the US holiday. Therefore to see if this really is a Double Top Reversal, we’ll have to wait for developments in a couple more sessions.


WTI Price Implications

If the reversal pattern is confirmed with a break below the $95.40 support level, a common price target would be the support level minus the difference between the peak and the support. Hence WTI may fall to around $92.30 in the coming days. Having said this, WTI has gained in US trading today, and if increasing volumes are seen in conjunction with these increases then it could be that the break in the upward trend is just temporary.