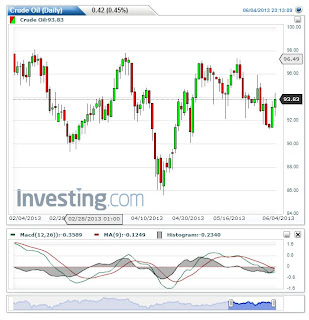
WTI has trended downward from a high of $96.8 on 20th
May to reach as low as $91.20 at the start of the week, before rebounding back
up to where it currently sits at $93.8. While the grade saw some strength in
the last couple of days, the question we need to answer is whether this is a
rebound from technical resistance that will result in an upward trend, or
whether the grade is destined to fall further over the coming days. To answer
this question, let’s look at some of the technical indicators.
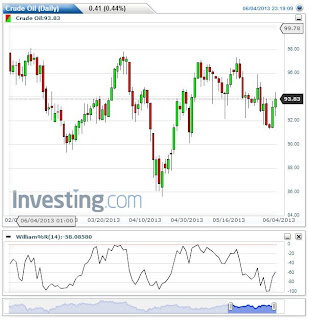
Firstly, two oscillating indicators, the MACD and Williams
%R both give slightly bearish signals on the daily chart. In terms of the MACD as shown below,
there was a signal crossover back at the fall from the peak price on the 21st,
while a zero-line downward cross was seen at the middle of last week. Both
predicted the trend over the following days well, and both remain in bearish
territory, albeit with the MACD showing some sign that it could cross the
signal line if positive momentum continues.
The Williams %R below shows similar signs, with the indicator
having made a bearish cross back on the 22nd May when it fell below
the -50 mark, before falling deep into oversold territory on Friday 31st
May. Such oversold signs could go to explain the current rebound, in which the
indicator is yet to test either the -50 mark or the overbought area at -20 and
above and hence remains somewhat inconclusive.
Importantly though, Bollinger band patterns appear to be
showing an “M top” pattern, in which the WTI grade failed to reach the upper Bollinger
band on either of its last two high-points, with the second point diverging
further than the first. This was followed by a strong cross of the middle-band
and the crossing of previous support, with the grade settling below its lower
band on two occasions in the last four sessions, showing the strength of the
bearish momentum and suggesting that the latest rebound could be a
slight correction on a downward trend rather than the reversal of that trend.
Trade Recommendation
With tomorrow the day for the weekly EIA report, the results
will be the perfect opportunity for bears to grapple with the bulls and
determine whether this downward trend for WTI will continue. I believe such an
outcome is likely, and unless WTI shows signs of breaking above the $94, or if
the grade does break above but then falls back strongly, then I suggest selling
WTI with a target of $92-$91.5.


No comments:
Post a Comment