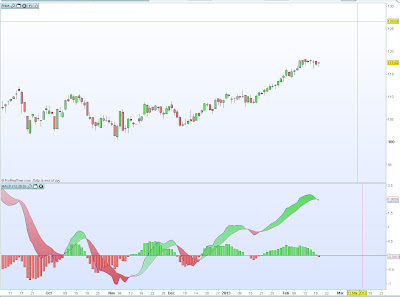
Brent has been on an upward trend for weeks, but has slipped
in recent days after touching $199.17 on 8th February.
As the chart below shows, technical analysis based on data
from the end of the day yesterday indicated Brent could be heading for a
reversal, in a similar fashion to the technical post on
WTI yesterday.
Firstly, we can see a pronounced “Hanging man” formation on
the 15th, when the within-day price fell $1.7 from opening to reach
a low of $116.3, before closing back at $117.7. The formation shows that while there
were buyers in the markets, they did not have enough power to completely
overwhelm the bearish sentiment. What’s more, a similar pattern was seen
yesterday when the grade closed at $117.52, slightly up on the open, but tested
the waters as low as $116.56.
In addition to these signs, the technical MACD indicator
provides a bearish confirmation; as the lower section of the chart shows, the MACD
line has crossed over the signal line, indicating momentum may now be entering
a bearish trend.
Indeed, in trading today we have seen a large fall in oil
markets, with WTI falling $2 and Brent dropping $1.9. However there have been
two fundamental reasons contributed to this fall; Bloomberg
suggests a hedge fund liquidating its overall position caused a large sell-off,
and with the March contract expiring today a rolling over to April contracts
resulted in the March price dropping further.
While there seem to be fundamental reasons for the fall seen
today in both WTI and Brent, it will be interesting if the fact that these
drops have confirmed the signals discussed in Brent above, and in the WTI post
yesterday, will result in prices of the two grades developing as predicted,
which we’ll review at the weekend.

Technical charts like these can be referred to learn market movements and behavior. Traders must stay updated with market fluctuations to trade in a wise manner. Commodity market traders can earn better by using mcx tips as depicted by experts.
ReplyDelete