Tonight’s industry-backed API crude inventory report showed
US domestic crude stocks increased a staggering 8.97 million barrels, way above
the estimate of a 0.5 million rise predicted by a Bloomberg survey. Following the announcement, WTI prices
declined by approximately $0.5, although had risen by nearly $0.8 in the two
hours before the announcement. With tomorrow’s EIA report likely to show a
similar rise in stocks, and markets trading down today due to the Bank of Japan
refraining from adding additional stimulus, do the technical support the view
that crude could fall further?
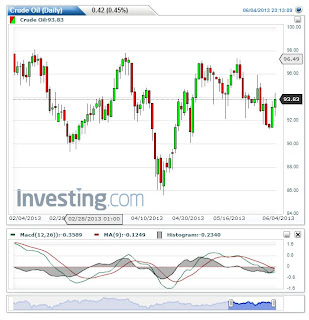
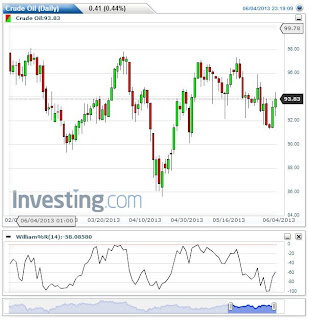
On the daily chart below we have three indicators shown; Bollinger
bands, the MACD and the William %R. At the moment neither the MACD or William
%R have cross into selling territory, as we would expect the green MACD line to
cross the red signal line or the zero line and the W%R to cross below -50. As
we can see from the latest candlestick on the daily chart, the reason for these
both remaining some strength is that the WTI crude price rebounded from its
earlier low of $94 to its current level of $94.86. Given the rebound happened
before the much higher than expected rise in inventories, we can gather some
clues from the higher frequency charts as to whether the price may decline
further tomorrow.
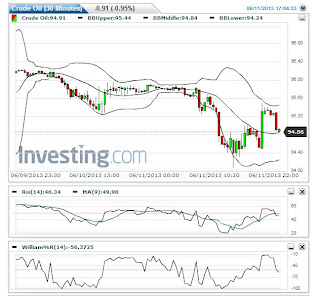
On the 30-minute chart below, the same three indicators show
that crude is also testing its 30 minute middle-Bollinger band (the 20-day MA),
the MACD lines are in a similar place to the daily chart and while the W%R has
already crossed below the -50 mark.
With both charts testing typical support areas, the MACDs
approaching a potential cross-over selling signal and the W%R of the higher
frequency already giving a sell signal, signs are strong that WTI has the
potential to carry on falling further if economic sentiment remains bearish
tomorrow. However, traders looking to go short should wait until a full set of
signals are received. On the higher frequency charts, resistance areas can be seen at around $94.5-94.4. If this boundary is breached, we should expect to see WTI fall to the $94 boundary,
which marks both the 20 and 200 day MA.


