Tuesday, 11 June 2013

WTI crude technical analysis: how will prices react to tomorrows EIA inventories report?

Tonight’s industry-backed API crude inventory report showed US domestic crude stocks increased a staggering 8.97 million barrels, way above the estimate of a 0.5 million rise predicted by a Bloomberg survey.  Following the announcement, WTI prices declined by approximately $0.5, although had risen by nearly $0.8 in the two hours before the announcement. With tomorrow’s EIA report likely to show a similar rise in stocks, and markets trading down today due to the Bank of Japan refraining from adding additional stimulus, do the technical support the view that crude could fall further?

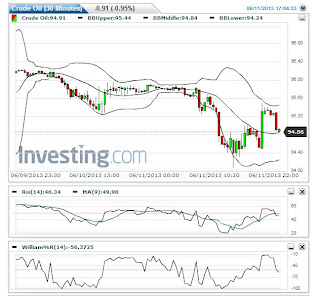
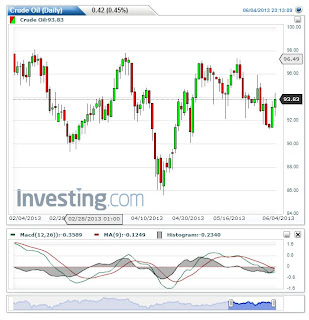
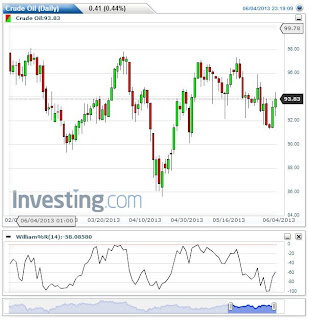
On the daily chart below we have three indicators shown; Bollinger bands, the MACD and the William %R. At the moment neither the MACD or William %R have cross into selling territory, as we would expect the green MACD line to cross the red signal line or the zero line and the W%R to cross below -50. As we can see from the latest candlestick on the daily chart, the reason for these both remaining some strength is that the WTI crude price rebounded from its earlier low of $94 to its current level of $94.86. Given the rebound happened before the much higher than expected rise in inventories, we can gather some clues from the higher frequency charts as to whether the price may decline further tomorrow.


On the 30-minute chart below, the same three indicators show that crude is also testing its 30 minute middle-Bollinger band (the 20-day MA), the MACD lines are in a similar place to the daily chart and while the W%R has already crossed below the -50 mark.


With both charts testing typical support areas, the MACDs approaching a potential cross-over selling signal and the W%R of the higher frequency already giving a sell signal, signs are strong that WTI has the potential to carry on falling further if economic sentiment remains bearish tomorrow. However, traders looking to go short should wait until a full set of signals are received. On the higher frequency charts, resistance areas can be seen at around $94.5-94.4. If this boundary is breached, we should expect to see WTI fall to the $94 boundary, which marks both the 20 and 200 day MA. 

Tuesday, 4 June 2013

WTI Crude Technical Analysis: Further to fall?

WTI has trended downward from a high of $96.8 on 20th May to reach as low as $91.20 at the start of the week, before rebounding back up to where it currently sits at $93.8. While the grade saw some strength in the last couple of days, the question we need to answer is whether this is a rebound from technical resistance that will result in an upward trend, or whether the grade is destined to fall further over the coming days. To answer this question, let’s look at some of the technical indicators.

Firstly, two oscillating indicators, the MACD and Williams %R both give slightly bearish signals on the daily chart. In terms of the MACD as shown below, there was a signal crossover back at the fall from the peak price on the 21st, while a zero-line downward cross was seen at the middle of last week. Both predicted the trend over the following days well, and both remain in bearish territory, albeit with the MACD showing some sign that it could cross the signal line if positive momentum continues.


The Williams %R below shows similar signs, with the indicator having made a bearish cross back on the 22nd May when it fell below the -50 mark, before falling deep into oversold territory on Friday 31st May. Such oversold signs could go to explain the current rebound, in which the indicator is yet to test either the -50 mark or the overbought area at -20 and above and hence remains somewhat inconclusive.


Importantly though, Bollinger band patterns appear to be showing an “M top” pattern, in which the WTI grade failed to reach the upper Bollinger band on either of its last two high-points, with the second point diverging further than the first. This was followed by a strong cross of the middle-band and the crossing of previous support, with the grade settling below its lower band on two occasions in the last four sessions, showing the strength of the bearish momentum and suggesting that the latest rebound could be a slight correction on a downward trend rather than the reversal of that trend.


Trade Recommendation


With tomorrow the day for the weekly EIA report, the results will be the perfect opportunity for bears to grapple with the bulls and determine whether this downward trend for WTI will continue. I believe such an outcome is likely, and unless WTI shows signs of breaking above the $94, or if the grade does break above but then falls back strongly, then I suggest selling WTI with a target of  $92-$91.5. 

Thursday, 23 May 2013

Brent and WTI technical analysis: Waiting for a trend form?


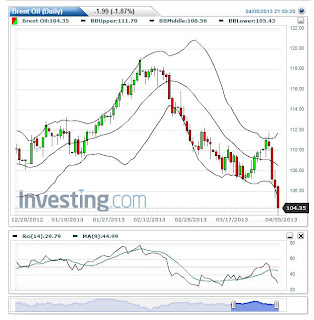
As the charts below shows, Brent and WTI have both been trading in a range since the beginning of May, with the North Sea grade ranging between $101-$105 and the US grade trading between $92 and $97.


A variety of factors have contributed to the sideways motion, but above all markets are locked in a battle of sentiment, with negative economic news one day balancing out against positive signs the other. Importantly however, technical analysis shows that if we are about to embark on another trend, then we could be looking at a strong bullish one.

The reason for this is that the lower Bollinger band has combined with the lower support area to form a very strong area of support that could form the lowest point of the next upward trend. What’s more, today both WTI and Brent dropped below these respective areas but climbed straight back up, unable to closer below them, thereby confirming the support areas as the charts below show.


It could be a few days before we confirm a possible upward trend, but the moving average indicators could be the key to demonstrating the upward move. At the moment on both the Brent and WTI charts above we see that the 10-day moving average (MA) has been mostly steady over the last week, with the 5-day oscillating above and below, confirming the range-trending scenario. Thus if we’re to see Brent and WTI break out into an upward trend then the first key signs will be for the 5-day to maintain its current position above the 10-day MA, and for the 10-day MA to lift itself away from its current position on both graphs, that is above and beyond the 20-day (the middle Bollinger band).  

Monday, 13 May 2013

The Correlation between Oil and Other Market Products: Equities


Many traders look for correlation strategies where either a trend in some security translates into a trend in another, or the disconnection of trends between two normally correlated securities results in a potential trade opportunity as the prices re-converge. Much of the most popular information out there at the moment is on currency correlations, but possible trade ideas are not just confined to products within the same asset class. Indeed, in the first of a series of posts looking at how oil trades in relation to other products, I’ll be taking a general look at the relationship between oil and equities.

To begin with, a quick overview of the causes of oil price changes is necessary to give some context to the changing relationship between oil and equities. On a fundamental level, there are four possible causes of oil price changes stemming from changing supply and demand, with the effect on equities outlined on the table below:


Increasing oil prices can be caused by either higher demand or lower supply and the cause behind the oil price change will determine the effect on equities and thus the correlation between the two. In the case of higher demand the cause behind the rise in prices is higher spending across the economy, thus increasing corporate profits as well. In the case lower supply, higher costs to consumer’s fuel bills will likely reduce disposable income and thus cause corporate profits to fall. On the other hand lower oil prices could be caused by either lower demand, and thus lower spending and lower corporate profits, or higher supply and thus lower costs and higher corporate profits. Obviously these are general cases which have their own contradictions in the long-term, such as increasing fuel efficiency decreasing oil demand while increasing disposable income, but such examples tend not to distort short-term correlations.

To demonstrate the changing relationship between oil and equities over 2013, the two charts below show week on week price changes of the S&P 500 US equities index and Brent as well as the 10 day correlation between the two price levels. In the first marked section from mid-January to the beginning of March, Brent and the S&P 500 mostly moved in tandem with each other. For a period during March however, the two moved away from each other as the S&P 500 increased while oil prices fell. Followers of markets will remember that the first time period was characterised by increasing economic confidence to begin with, which led to higher demand expectations for both equities and oil, but was then followed by economic news failing to meet expectations as both prices fell. In early March however both demand forecast cuts by international agencies and further problems in the euro area cut expected global oil demand and thus prices for Brent, while US equities continued to advance as conditions there were generally positive.


How to profit from the correlation

While many other factors come into play, particularly in today’s climate of quantitative easing, the correlation between US equities and oil begins to show the potential of correlation strategies in creating profitable trades. Take the point marked A on the graph below as an example, oil and equity had been highly correlated on economic confidence, but some worse than expected economic data releases resulted in falling US equities and oil prices. In this case shorting both on those announcements would have been profitable strategy. 


Next week this series of posts will take a look at how oil prices are correlated with currencies, so check back soon.

Saturday, 20 April 2013

Weekly Crude and WTI Oil Market Summary: Brent falls below $100 for first time in 9 months.


15/Apr/13 - 19/Apr/13

In the week preceding this, announcements form major international energy organisations adjusting oil demand forecasts downward caused a massive sell-off of the energy commodity, and the trend continued this week as economic data continued to cause prices falls in WTI and Brent. Brent lost -3.3% and WTI -3.6%, with Brent maintaining its premium as the spread closed yesterday at $11.6, the same level it opened at on Monday. Notably Brent closed below $100 on Tuesday for the first time since July, but failed to maintain a rebound above $100 on Friday.


Weekly Summary

Weak economic data showing Chinese GDP growth failed to meet expectations caused plunging Brent and WTI prices on Monday, with the grade failing to rally in European afternoon trading as US data confirmed economic weakness there as well. Due to the Chinese data, Brent opened in European trading $0.4 below its previous close, and then continued to lose -1.9% in trading. WTI meanwhile gapped down a similar amount but fell a larger -2.5% in trading. Further demand forecasts were cut by the World Bank, which reduced its growth forecasts for East Asia and warned of potential overheating, which would require central banks to raise interest rates. While the sell-off caused Brent to fall to its lowest close since August 2012, markets were more focussed on Gold which lost a massive 10% in one day of trading. The fall was caused by a bearish reaction to signs that indebted governments, such as Cyprus, may have forced to sell hard gold assets in exchange for financial bail-outs.

Crude continued to fall overnight in Asian trading, and Brent lost $1.7 from its Monday close to open in Europe at $99, similar to WTI which lost $1.3 overnight. While the grades rebounded in European trading, with Brent gaining 1% and WTI 1.5%, the earlier falls meant that Brent fell below $100 for the first time in 9 months. The European within-day rebound was similarly seen in other commodity markets, which may have been caused by a fall in the USD and a feeling that the previous drop was too much too soon, prompting some buyers to take advantage of the lower prices.

Such a move was ill-conceived however, and crude plummeted again on Wednesday in a reaction to the weekly EIA release showing increasing production and falling demand. For more details on the release, see my weekly inventory post. Bearish sentiment also entered the market as US corporate earnings came in at disappointing levels, and the USD strengthened from its previous fall, gaining 1.3% versus the euro. The bearish report and negative correlations with such currency gains caused Brent to fall -2.3% and WTI -2.4% on the day.

WTI and Brent had both closed below their lower Bollinger band on Wednesday, which as the graph shows in previous sessions had caused a next-day rebound which was demonstrated again on Thursday, prompted by further technical support from the RSI being below the 30-mark (see my previous technical trading post for more on the RSI). Such signs typically see buyers enter, even if for short-term profits. Signs of longer-term profits were also seen as the long bearish run raised the expectation that OPEC may begin to feel an output cut is necessary. Venezuela is particular announced concerns on Thursday, and with the country under political turmoil following a disputed election, there is a strong incentive for the government to secure higher oil prices and thus budget revenues. Despite the next OPEC meeting not being scheduled until 31st May, prices could rise in the interim as Shell declared force majeure on its Nigerian Light Bonny crude for pipeline repairs and data shows seaborne exports from OPEC will fall in the four weeks to May 4. Rises in Brent and WTI could have been higher were it not for economic activity indicators out of the US coming in negative.


Reports that an ad-hoc OPEC meeting could be held boosted Brent on Friday, but apart from that a lack of notable data traders had a comparatively quiet day, with WTI falling a -0.4% and Brent up 0.2%. By the afternoon, OPEC had denied the announcement and Capital Economics pointed out most OPEC nations are comparatively healthy after recent high oil prices, and so urgency may not be on the cards. PVM, an oil-broker, suggested that the week-end rally is likely to have been caused by a closing of short positions before the weekend and for profit-taking at the $100 mark, resulting in the North Sea blend dropping back to close at $99.65.

Week Ahead

Next week will be quite data-heavy, with a number of global data releases being released. In the US,  everyday next week promises a release that normally moves markets, with home data on Monday and Tuesday, goods orders on Wednesday, the regular weekly jobs update on Thursday and a first-release of Q1 GDP data on Friday. China will see its monthly PMI first release early on Tuesday, which will be of particular note as the indicator has a high correlation with GDP, therefore giving an indication of how Q2 GDP could develop. The euro area first-estimate PMI will also be released after China’s, which could bring the euro zone back into focus again, particularly with investors waiting to see whether the ECB will engage in full-blown QE. This will be followed by the German IFO on Wednesday, which gives an indication of business confidence the euro area’s largest economy. On Thursday UK GDP data will be releases.

On a technical view, investors will be waiting to see whether the current situation is a temporary retracement on a continuing bearish run, or whether we have now hit the bottom and be aligned with fundamentals. Some analysts say $85 would be an appropriate price for WTI, while OPEC in particular may not be happy with less than $100 for Brent. Given current fundamental infrastructure issues between the two grades ( see “On a path to convergence”) mean a spread of closer to $10 than $15 is appropriate, we’ll have to wait and see to find out which grades gives in. For more detailed technical analysis, look out for tomorrow’s week-beginning technical update.

Wednesday, 17 April 2013

Weekly WTI Crude Oil Inventory Analysis: EIA release of 17th April

Summary of today’s release: last weeks’ change in Crude Inventories figures:


API: -6.7m
EIA Consensus:  +1.2m
EIA actual: -1.2m

Crude continued its bearish run today, with both grades dropping by more than 2% in the face on an EIA report that continued to remind traders of the fragile demand and supply situation in the US. While overall crude stocks dropped, the cause of this fall seemed to be a reduction in imports rather than an improving US demand situation. Indeed, the detail showed that US domestic production had increased while refinery input decreased. These factors, combined with a large stock-build at Cushing and a fall in distillate and gasoline products supplied to consumers, reinforced the current bearish outlook.

Detailed Breakdown

US domestic crude production climbed 27,000 barrels to reach 7.2mb/d last week, while net refinery input dropped by 40,000 b/d. The fall in refinery input only represents a 4% drop in the gains seen over the preceding 4 weeks, and could be a result of the continued softness of crude product demand in the shoulder period between winter fuel and summer gasoline peak demand. Such a demand situation was confirmed in this release, with gasoline product supplied falling by 94k/d and distillate fuel by -226k/d.


The bearish reaction to the drop in stocks may also have been caused by details in the regional breakdown. Despite the -1.2mb fall, the region that caused this decline was the demand heavy West Coast, where stocks fell by -1.8mb. Meanwhile, there was a 1mb rise at Cushing, with stocks there reaching the highest point since January. With a lot of traders focussed on transportation bottlenecks, such a sign is worrying as it implies crude might be finding its way to Cushing but not onward to the Gulf Coast. Such an idea may have been affected by the recent completion of the line-fill of the Longhorn pipeline, which was completed last week. This process was taking up some crude from the system, but actual deliveries are not expected until this week, and so this could have caused the temporary build-up (For more on that see my previous post Seaway No Solution).

How Markets Reacted

Brent has been on a bearish run since 2nd April, when the grade reached $111.8 before dropping by $14.1 to end today at $97.7. WTI began its bearish run a few days earlier, falling from $97.7 to reach just under $87 today. Clearly there is a bearish sentiment in the market, and as in other weeks we’ve seen market reacting positively despite a negative headline number, this week we see markets reacting negatively despite a positive headline number.

As the chart shows, the Brent price initially ticked up slightly at 14:30 GMT after the release, but soon dropped by about $0.90 as analysts saw the details and continued to drop by a further $0.5 before rebounding slightly after the European closed. WTI followed a similar pattern, and both grades dropped on the day.


Outlook: How Low Will It Go?

US production reaching a 20-year high was hailed as a major headline by some news outlets, but in reality we already saw that headline a few weeks ago, and will likely continue to see it this year. As regular followers of the EIA report will know, the details can be overshadowed by the current market sentiment, with what we’ve seen over the past two weeks of a bearish market possibly being a correction to the previous weeks in which crude has increased endlessly despite bearish details and a loose market. Hence it’s difficult to predict next week’s release, but crude will likely rebound at some point, albeit perhaps temporarily.

In particular, technical indicators such as the RSI show that WTI could be due a rebound before the end of this week. As the day-chart below shows, WTI has reached a new low while the RSI has failed to reach a lower low than the one two days ago. This is known as an RSI bullish divergence, as detailed in my previous post of technical trading strategies.


Tuesday, 9 April 2013

Crude Oil Technical Strategy: Trading the Relative Strength Index (RSI)


Read oil market news and you're bound to come across references to technical analysis, which is viewed by many traders as an important tool in predicting price changes and signalling market momentum. While most will say that technical analysis should be used as a confirmation of fundamental views, there are many traders who claim to have successfully implemented trading strategies based solely on quantitative and technical analysis. In the first of a series of posts, I'll be looking at whether a simple momentum indicator can be used to create a profitable oil trading strategy.

The first indicator we’ll look at is the Relative Strength Index (RSI). The RSI is a momentum oscillator; it cycles between a value of 1 and 100 and measures the trading-momentum of a security.  A higher measure indicates a security could be overbought and a lower number oversold. (For more on the calculation of the RSI, check out this article at Investopedia.) A rough guide is that anything over 70 represents the security being overbought, and anything below 30 represents oversold. A potential strategy therefore can be to go short when the reading is over 70 and go long when its below 30. While there are plenty of articles out there discussing the strategy for stocks and currencies, how does the strategy play out for crude?

To take a first-look at the strategy, I’ve downloaded a price-set from EIA and created a 14-day RSI for the beginning of 1986 to the beginning of 2013. Using a VBA-script, the file loops through the data and works out the return from a buy and sell strategy in which the upper and lower RSI limits vary, thereby allowing for values of the upper and lower bounds to vary around the 30 and 70 marks. 

The table below shows the results. The non-strategy return, that is buying crude on day 1 and selling on the last day, results in a return of 389%; an equivalent annual rate of 6.1%. As the highlighted cells show, the best strategies are located around the (30-40, 76) limits or the (40-44, 60-64) limits, with the two best results being (44, 62) and (40, 76).


When using the (40,76) options for the lower and upper limit, there are only 88 days when the RSI is over 76 but 1208 when it is below 40, out of a total 6828 days in the data set; thus the strategy is almost entirely just predicting a few key selling points. In contrast, the (44, 62) presents a more-even strategy as there are 1829 buys and 1259 sells. (44, 62) however is a long way from the orthodox 30 and 70 mark; so is RSI really applicable in this case, or are we just getting lucky?

The truth is, the RSI alone is probably not going to give us a profitable trading strategy. As OptionAlpha points out, a more powerful indicator can actually be an RSI divergence. This is when the price reaches a higher high (lower low) but the RSI fails to reaches below its previous high (low). Graphically we mean something like below (taken from OptionALpha). This could explain why less extreme RSI thresholds are actually giving a better return. Alternatively, it may be we need to combine the RSI with another indicator to give a better indication of possible trends. In fact it’s common to use the RSI with a moving-average indicator; something we'll look at in more detail in the next post in this series.


Sunday, 7 April 2013

Brent-WTI Spread Update: On a Path to Convergence?


The WTI-Brent spread has been big news for traders since the beginning of the year, and the spread has cycled in an $11.8 range since January 1st. As the chart below shows, the premium started the year at $19.4, fell as low as $15.5 in mid-January and then rose back up to $23.2 in early February. Since then the spread has dropped dramatically, falling by $9.4 since March 5th, closing on Friday at $11.4. The question is what’s caused this reversal in the last few weeks? And will Brent’s premium over the US blend continue to fall?


A variety of factors have been behind the recent narrowing of the Brent-WTI spread. Firstly a look at Brent: The North Sea grade was priced at $118 in mid-February, but the price has since dropped to $104.1. Yet there has been only slight signs that economic growth may not be as strong as it was considered back then, which if anything could actually rise the expectation of monetary easing programs and thus go to increasing commodity prices. So what has caused this $14 drop? Supply fundamentals have been one reason; production that had been curtailed due to a pipeline leak has come back on-line, while some smaller fields are also planning crude deliveries in April, from none in March. In fact, North Sea output will be 15% higher this month than March; hence supply on the spot market is particularly loose.

Seasonal refinery maintenance programs in Europe and other continents have also reduced demand for the North Sea blend, while demand has also been affected by a potential South Korean decision to close a tax loophole that had previously allowed refiners in that country to claim a $3 tax rebate on each barrel of Brent crude, despite not actually paying the tax due to a free-trade agreement with European countries. The rebate, which came into effect in 2011, had resulted in an eightfold increase in South Korean crude imports from Britain last year to an average of 70,000 b/d. But the potential change in tax law, which was announced early last month, resulted in a fall in ships transporting oil to Korea.

Apart from the changing demand and supply fundamentals, the geopolitical risk premium built into the Brent price has also dropped, particularly with regard to the situation in Iran. BCA Research published a great graph at the end of March showing how the price of Brent deviates from a fair-value model they have in correlation with the level of Iran references on Google, such as news events. Indeed price deviations seemed to spike with these references and then fall in a lag, which would explain the fall in prices seen in the last week relative to WTI.  The borrowed-graph from the article is below.


It’s not just Brent’s fundamental situation that is changing. The supply infrastructure for US crude, with WTI as the main benchmark, has been rapidly changing this year as more and more crude is taken by road and rail in an attempt to relieve the supply gluts that had formed at various points in the supply chain, particularly Cushing where the benchmark price is set. These alternatives to pipeline transportation are expected to grow this year; for instance Warren Buffet’s Burlington Northern Santa Fe railroad company expects crude transport to increase 40% this year. Media also reported that Crude was being trucked out of Cushing all the way to the Gulf Coast, a method that can cost up to $20 a barrel. The start-up of the reversed Longhorn pipeline from the West-Texas Permian basin in March also resulted in crude being taken off the route that flows through Cushing, thereby reducing pressure at the price-forming point. The pipeline has to be injected with an initial 900,000 barrels of oil before flow can start, which itself thereby serves as a sort of storage.

All of these infrastructure changes are taking place at a time when US refineries typically ramp-up production in anticipation of the US summer season, when gasoline in particular is of higher demand and when the quality of the fuel has to be higher as well. Crude imports have also been phased out as more of the domestic crude becomes accessible to refiners, particularly to the gulf coast which has seen more and more domestic crude delivered to the region. Rail connections are also enabling East-Coast refineries, which typically import all of their crude input, to start taking some of the US-produced oil and thus limit supply gluts elsewhere in the country. As such demand for WTI has been increasing and demand for Brent has fallen.

The future for the Brent-WTI premium

Based on the current looseness of the Brent supply situation and a lull in the risk-premium that the grade has been experiencing in the last few months, I actually expect the main risk over the next couple of months to be that the Brent-WTI spread will widen, despite the continuing trend of narrowing. The US remains extremely well supplied, and while some new pipeline infrastructure will take some of the pressure off supply gluts in the Mid-West, these will simply be transferred to the Gulf Coast where more storage is available, but where many of the refineries are not actually set up to refine light sweet oil such as WTI. Brent meanwhile will likely find some strength over the coming weeks as refinery production ramps up and China may take advantage of prices that are $14 lower than their recent peak to replenish supplies. What’s more, the South Korean tax decision has been delayed for a further three months until July, which will support Brent prices.

Having said this, based on better mobility of US crude from rail and road, as well as increased demand from refineries, can we expect the Brent-WTI premium to move back down to zero towards the back of the year? The answer is no, this level of convergence will not be seen for a few years at least. In fact it’s important to note that despite improvements in mobility, the spread between Brent and WTI needs to remain at a level which continues to make rail movements profitable. Given the cost of transporting oil from Bakken in North Dakota to the East Coast is about $15, and that Bakken oil currently trades at around parity to WTI, we shouldn’t expect a fall in the Brent-WTI premium to much below its current level to be sustainable. In terms of other analyst’s forecasts, recent releases show that Societe General expects an average spread of $16 this year, and Morgan Stanley expects a spread of 14.50. Given this year’s current average is $17.7 so far, these forecasts imply the spread will average $15.4 and $13.4 over the remaining 9 months. I would say the latter seems more likely unless we see a re-ignition of the geopolitical risk premium.

Saturday, 6 April 2013

Weekly Crude and WTI Oil Market Summary: An overdue price correction


01/Apr/13 - 05/Apr/13

Oil experienced its biggest weekly drop in six months this week as WTI lost -4.6% and Brent -5.4% from their previous weekly close. The cause of the drop was a mixture of weak US and Chinese economic data combined with a correction of prices in response to the looser supply situation, as US stocks reached a 22-year high. WTI continued to get support from the start of the summer refinery season in the US while the increase in Brent deliveries in April led to some price pressure for the European blend. Based On this, the premium of Brent to WTI dropped to close the week at a low of $11.4, not seen since June last year.

Weekly Summary

Weaker manufacturing data out of the US and China did little to support economic confidence in markets on Monday, and the early news from the East caused WTI and Brent to both gap down on their opening in Europe, where volumes remained low due to the Easter holiday. WTI lost $1.1 from its Thursday close to open at $92.4, and Brent $0.9 to open at $108.9. Despite the downbeat economic news, the resulting weakness of the USD actually provided support to oil during the day and Brent gained 0.8%. WTI however was hit by news that the Pegasus pipeline in the US, which forms part of a longer pipeline carrying heavy Canadian crude to the gulf coast, was shut due to a leak and big environmental concerns. The news meant more crude was likely to build up in the Midwest and thus put downward pressure on prices, causing WTI to fall by 0.8%.

US February factory orders came out as positive on Tuesday, but the main cause of the increase came from the volatile aeroplane orders component and consumer-durables, which masked a drop in the core orders that signal business investment. Despite the future outlook for investment looking fragile, the increase in consumer goods supported the WTI spot market which gained 0.3%.  Brent however lost ground, falling -0.4% on the day.

The after-hours US API crude inventories report came in extremely negative for markets, showing a 4.7mb rise. The EIA report on Wednesday confirmed a large rise, with the details explained in the weekly inventory analysis. With a number of technical indicators suggesting WTI in particular was overbought on Tuesday’s close, the rise in inventories to a 22-year high coupled with weak economic data to create an extremely bearish environment for both WTI and Brent. The US grade dropped -2.4% while Brent fell -2.9%. Many claimed the correction was long overdue, with the supply situation extremely loose at the moment. The higher fall in Brent resulted in a drop in the Brent-WTI premium, ending the day at just $12.6.

The downward momentum continued on Thursday, with WTI falling by -1.2% and Brent -0.7%, with the technical momentum combining with a weaker US jobless claims number to bring down expectations of growth and spending in the US economy.  

The weaker US job insurance claims number indeed translated into a weaker than expected US non-farms payroll on Friday. Given the indicators position as the most-watched indicator of the month, the negative effect fed into markets where WTI lost -0.9% but Brent lost -2.3%. Weak euro zone retail sales continued to remind traders about the delicateness of the European economic situation and thus Brent demand, while progress from Iranian negotiations about the nuclear situation in that country may have reduced Brent’s risk premium. Meanwhile WTI continues to gain support from the start on the US refinery system despite concerns of the Pegasus pipeline, and the Brent-WTI premium dropped to a low of $11.4, not seen since June 2012.

Week Ahead

Oil may have fallen further this week on supply and demand fundamentals were it not for the fact that the employment situation in the US means the Fed’s QE program will continue for longer, given their targeting of the unemployment rate. This fact resulted in a weaker dollar, which led to some support for USD priced commodities such as oil. Having said this, markets seem to have realised that oil was simply priced too high given the supply situation; a great graph which demonstrates this is the US day’s ahead supply chart as shown below. Clearly, this year’s supply levels, which on this chart takes into account the level of demand as well, is much more elevated than previous years.


Such facts could mean oil may fall weaker this week, but interestingly it’s Brent’s technical indicators that show an indication that the grade may be heavily oversold rather than WTI, which had rallied strongly in the preceding weeks. As the graphs below show, Brent has finished below it's bollinger band on Friday, and the RSI has dropped below 30. Meanwhile, WTI still seems relatively strong on those indicators because of its strong rally the previous week. Indeed, now might be a good idea to buy Brent, given Saudi’s position as a swing producer for global Brent means the nation won’t let supplies increase too high, and given Libya’s continued production problems and Iraq’s indication last week that supplies probably won't be as high as some forecast. WTI meanwhile is benefitting from pipelines being built that themselves hold a large amount of oil and will transfer supply gluts in the Midwest to the Gulf Coast, but if there simply isn't demand in the midwest then prices will once again rise. Most of all it’s important to remember that a lot of US crude is now being shipped by rail, a transport method that costs a lot more than pipeline or ships and thus we would expect a much higher average Brent premium over the year as pipelines are being built – so be careful of expecting the premium to fall much below the $10 range.


Wednesday, 3 April 2013

Weekly WTI Crude Oil Inventory Analysis: EIA release of 3rd April

Summary of today’s release: last weeks’ change in Crude Inventories figures:


API: +4.7 mb
EIA Consensus:  +2.2 mb
EIA actual: +2.7 mb

A mostly bearish oil inventory report was met strongly on the downside by an overbought oil market, prompting a strong correction today for both WTI and Brent prices. The headline stocks increase resulted in a rise in inventories to their highest level in 22 years, and this combined with a generally negative sentiment across markets to result in the highest daily loss for oil markets in 2013 so far.

Detailed Breakdown

Markets have previously reacted positively to overall crude inventory rises so long as stocks at Cushing had fallen. However this was not the case today; Cushing supplies dropped by -287,000 - now 2.68 mb below the peak in early January. Instead increases came from other parts of the Midwest, PADD2 region, as well as the Gulf Coast. Part of the drop in stocks at Cushing can be attributed to the current filling of the longhorn pipeline, which must be done before oil gas actually be transported to refiners and has diverted some of the flow from Cushing. However media also reports oil is now being trucked out of Cushing to connect with rail and water transport.

The fine details of the report actually had several positive, albeit subdued, signs; refinery utilisation increased 0.6%pts to 86.3% and demand for gasoline rose 1.5%. A fall in distillate stocks despite lower demand and higher production also implied a healthy export market for refiner’s products. Day’s supply, which measures the stock level of crude compared to current demand, also dropped by 0.3 days despite the increase in stocks due to the rise in demand for crude from refiners. Hence this provides support to the idea that markets were making an overdue correction today rather than responding specifically to this one report; markets after all should react to the differences in demand and supply level, indicated by day’s cover, rather than an absolute supply level.

How Markets Reacted

As mentioned in the last few weekly report summaries, in the past few weeks markets have been picking up only on positive aspects, rather than to overall supply fundamentals. This week a correction has finally occurred with prices falling sharply, furthermore the strong level of momentum behind this indicates the trend could continue tomorrow; Brent fell -3% with trading volumes double their normal level, and WTI fell -2.8% (see chart below) with trading volumes over 30% higher.


While technical indicators were already giving overbought signals before the EIA release, it tends to take a strong showing of fundamental messages to spur the market into such a strong fall and indeed the bearish EIA report coincided with bearish economic indicators out of the US. Some level of acceptance that a geopolitical risk premium has been seeping away may also have contributed to the negative price momentum, with some analysts citing this as a reason to lower price forecasts.

Next week’s release

This week’s closure of the Pegasus pipeline, which links Midwest crude storage to Texan refineries, could add pressure to stocks next week. The pipeline normally carries 90,000 b/d of heavy Canadian crude, rather than light US produced crude, and therefore may not have an adverse effect on the US WTI prices.  Key details to look out for will be product demand, which will need to carry on increasing if supply gluts are not simply going to be transferred to other regions as pipeline infrastructure improves. 

Saturday, 30 March 2013

Weekly Crude and WTI Oil Market Summary: Brent-WTI premium reaches cyclical low


Both grades rallied strongly this week, with WTI gaining 3.7% and Brent 2.1%, as fears over a euro zone exit for Cyprus were overcome and economic data from the US was positive. Oil’s positions as an investment asset benefitted strongly from the S&P 500 reaching a record level, and a midweek EIA report showed positive signs for crude demand. This increased demand and signs inventories were shifting to the Gulf Coast resulted in the Brent-WTI premium ending the week at its lowest level since July.

Weekly Summary

Monday saw both grades rise on the day, with Brent increasing 0.4% from its $107.8 open and WTI 1% from its open of $93.9. The main cause of the gains was Cyprus meeting its deadline to secure an international bailout, with the policy shifting from a blanket tax on all depositors to one that will affect only those with a high level of deposits. Gains from the news were pared however when the Dutch Finance Minister Dijsselbloem suggested that so-called “bail-ins”, where the investors take losses rather than an external source, ie. the government, providing support, will be the new normal. This announcement spooked some investors who in turn moved funds from euro into USD, prompting a rise in the American currency and stalling oil’s gains further. Brent may have also received some support from an announcement by the Iraqi oil minister that despite the country’s progress in oil production, targets for 4.5 mb/d output for this year still may not be met due to absence of bureaucratic and political infrastructure.

The strongest day of the week for oil was seen on Tuesday, with WTI gaining 1.7% and Brent 1.2%. While momentum from the Cyprus deal continued, analysts also suggested physical flows were behind much of the increase for WTI, with refiners buying more crude in order to begin the gasoline production for the summer season. Economic indicators also provided support for the rally, with a gain in the US new home sales and prices as well as an increase in goods orders buoying markets. While the orders showed a decrease in those relating to capital spending, often used as proxy for business investment, this followed last month’s large gain and so most were unfazed by the news. The strength of both indicators shows the financial confidence of the US consumer is increasing.

The EIA report on Wednesday provided further support to the idea that refinery production was increasing, and thus that demand for both US-produced WTI should continue heating up over the coming weeks. Further details can be found in my weekly inventory post. The news was positive and WTI rose 0.5% and Brent 0.3%, but gains were pared as a euro zone consumer confidence report fell and the USD strengthened against its peers.

Weaker economic data on Thursday, with unemployment insurance claims up, might normally have led to falls in crude, but the process of the S&P 500 rising to its highest ever close supported markets throughout the day. Hence the week’s daily gains for WTI crude showed no signs of wavering on the last day of trading before the Good Friday close, with the US blend up 0.5% to close the week at $97.2. Brent meanwhile see-sawed in daily trading, with the reopening of Cyprus banks much reported and traders unlikely to take on any large positions before markets reopen in London on Tuesday. The grade eventually closed 0.1% up to end the week at $110. The strength divergence between the two grades resulted in the Brent-WTI premium closing below $13 for the first time since early July 2012.

Week Ahead

Data-wise, Friday sees the month’s most watched indicator, the US non-farm payrolls released. The weekly unemployment insurance claims data has been strong, and so a strong non-farm payrolls number is forecast by economists, who expect a 193,000 gain. Manufacturing surveys for China and US come out on Monday, and will dictate momentum early in the week. The Chinese index, which is only just in expansionary territory at 50.1, is forecast for a large gain of 1pt. Meanwhile the US index is currently well in the expansion region at 54.2, although is expected to fall slightly on the week. Given current US optimism, any lack of a serious fall should be met well by markets while a buoyant China number would definitely spur markets on for the US open. European markets remain closed until Tuesday.

Later on in the week, various central banks including the euro zone, UK and Japan meet to discuss monetary policy. Policy watchers will be keen to see euro zone comments after the Cyprus crisis, and Japan should continue to give an open outlook to monetary expansion.

While there are plenty of data and events out this week that could buoy markets, oil may take a hit if the S&P reverses from its record close on Thursday. Given the rise in the S&P was characterise by smaller and smaller gains in the run-up, there will likely be a correction as short-term traders take profit. Given the links between equities and oil, crude could therefore face a slight fall.

On a trend basis, WTI has rallied strongly this week, and with the start of the US refinery season beginning to start as well as a number of projects being completed to increase the flow of US-produced crude from the Midwest to the Gulf Coast refinery base we could continue to see gains over the coming weeks. The key level to look out for is $98, which the grade has tested twice before this year. This was also the level which the blend crossed in September before rallying up to $100 a few days later (see chart). Hence a strong EIA report or economic data this week could see the WTI blend quickly gaining $2 and even hitting $100 in intra-day trading.


As forecast last week, Brent did indeed rebound from the bottom of its rally and the grade has now gone back up to the $110 area. The grade had trended in $4 range with $110 in its centre before it rose up to $118 earlier in the year on geopolitical issues, and so a return to this range-trading is possible. It’s likely that anything under this range will prompt supply-cuts from Saudi, whereas anything above this is likely to be unsustainable until very strong economic signs from Europe and China.


Wednesday, 27 March 2013

Weekly WTI Crude Oil Inventory Analysis: EIA release of 27th March


Summary of today’s release: last weeks’ change in Crude Inventories figures:

API: +3.7mb
EIA Consensus:  +1.3mb
EIA actual: +3.3mb

A mixed inventory report was released today, showing a large build in crude inventories of 3.3mb, a whole 2 million barrels above survey expectations. While stock gains were large, markets were supported by the fact that refinery runs stepped up a gear in response to the upcoming spring gasoline refinery season, and a fall in distillate stocks led some to believe that prices for the products could rise over the coming weeks.

The Breakdown

The main bearish points of the report came from the large inventory increase, with 4 of the 5 PADD districts seeing increases. In particular the Gulf Coast saw a 1.5mb rise and Cushing a 439,000 barrel increase. As the graph shows, it’s normal for the Gulf Coast to see such a build at this time of year (represented by the red lines), but it’s also important to watch out for potential supply gluts forming in the area as new pipelines transport US produced crude to refineries that will eventually reach full capacity.


Positive signs came from refinery utilisation levels which jumped 2.2%pts to 85.7%, with net crude inputs increasing by 364,000 b/d. This was combined with a drop in distillate inventories of 4.5 mb, equal to a 4% fall, as well as a fall in gasoline stocks of -1.6mb. Such falls increase the outlook for higher prices and more production, particularly in the distillate market where stocks haven’t been this low for this time of year since 2008. Demand in the distillate produce market has also increased, with 642,000 extra b/d being supplied to wholesalers last week.

Such demand for heavier crude products could help explain the jump in crude imports last week, with 841,000 b/d extra being imported. Such an increase is likely to have all come from heavier blends of crude, the likes of which US are refiners are better set up to process and of which yield higher levels of heavy crude products. This goes to show that despite massive increases in US production of the last year, product producers continue to rely on imports.

How Markets Reacted

Prices for both WTI and Brent rose slightly on the news, with WTI up $0.24 and Brent up $0.44 by the end of US trading. Such a result shows that markets reacting positively to the EIA release, with other market forces, in particular a bearish European confidence report and a drop in the euro, normally resulting in losses for oil.

Next week’s release

There’s been plenty of talk in the markets this week that the Brent-WTI premium will continue falling, but I believe one of the key charts in an argument against this theory is the days supply chart that I provided a few weeks ago, as shown below. The chart shows days supply is almost 2 days higher than any year in the last 10, and based on normal patterns might not peak for a few more weeks.


Such a scenario makes a sudden market reaction to a future inventory report more likely, as we saw back in January when the Brent-WTI spread widened rapidly after evidence that the Seaway pipeline reversal did little to alleviate supply bottlenecks. Such a situation could happen again if we get confirmation of the effects of various pipelines over the next few weeks not alleviating supply gluts, or if a supply glut appears elsewhere in the system. Hence look out for regional stocks over the coming weeks, in particular at Cushing and the Gulf Coast.

Saturday, 23 March 2013

Weekly Crude and WTI Oil Market Summary: Brent-WTI premium falls as Cyprus threatens to blow


18/Mar/13 - 22/Mar/13

The previous week has been characterised as a wild-ride in global markets, with equities, currencies and commodities all experiencing sharp volatility. The cause of the volatility was a country in turmoil, as Cyprus had potential to become the first nation to leave the euro zone, potentially setting off a chain reaction with huge ramifications for the whole of Europe. Crude’s position as an investment asset was again demonstrated by its strong correlation to currencies and equities during the week, while the relatively strong domestic situation and improving infrastructure in the US resulted in a narrowing of the Brent-WTI premium. Overall WTI rose 0.2% on the week, while Brent fell -1.9%, resulting a narrowing of the spread by -$2.3 to $14.

Weekly Summary

Both WTI and Brent gapped down significantly from their Friday closing prices, as a proposed depositor tax in Cyprus, stated as necessary to secure an EU bailout, sparked political turmoil and protests in the country. When European markets opened on Monday, WTI was at $92.3, down $1.1 from its close and Brent was down $0.9 at $108.9. During the course of the day however, European leaders communicated that an easing of the bailout conditions was possible, and what seemed to some like a near-certain exit of the first country from the euro zone began to appear less likely. Because of this, WTI and Brent actually both managed to gain on the day, with WTI increasing 1.4% and Brent 0.6%.  Support for the more internationally-linked Brent may have come after comments by Saudi Oil Minister that $100 is a reasonable price for crude, as well as news that a Libyan pipeline that delivers around 120,000 b/d of crude had been shut.

Despite positive signs from the EU, the eventually defeat of the Bill designed to bring the deposit tax into law played havoc in the markets, where WTI fell -1.8% and Brent -1.7%. While some of the losses were due to uncertain expectations regarding future European output, some of the fall was also the result of a sharp decline in the euro and thus a strengthening USD which makes oil less attractive to holders on non-USD currencies. Media attention relating to last weeks’ reversal of the Longhorn pipeline may also have helped push down the Brent-WTI premium, which reached $15.3 by the end of trading.

Volatility continued on Wednesday as Brent prices climbed 1.0% and WTI prices 1.1%, with the main rise being due to the Fed announcing that it will maintain its rate of monetary easing in its monthly meeting, reiterating that the program will be continued until the labour market, which typically lags economic growth, shows signs of improving. In Cyprus, the announcement that banks would remain closed for the week and policy makers would have more time to discuss the EU bailout supported markets. Meanwhile in the US positive signs for WTI fundamentals were demonstrated by the weekly EIA inventory report that showed stocks at Cushing fell again, as explained in my weekly inventory analysis post. As such the Brent-WTI premium continued to fall, albeit only slightly.

Amid a Monday deadline for Cyprus to raise the funds necessary to secure the EU bailout, the country failed to make any progress in securing Russian-loans and instead sought capital controls to prevent funds leaving the island. What’s more, euro zone worries continued on as the manufacturing PMI, a survey-based indicator that closely leads economic growth, indicated a surprise fall in economic output and confidence. Worryingly the surveys that form the indicator were taken before the problems in Cyprus erupted. Hence crude continues its wild ride on Thursday, as prices for both grades deteriorated by 0.9%. Loses could have been worse were it not for supportive data from the US, where business confidence increases, and China where the PMI rose. However an announcement by the Iranian Supreme Leader that they would attack Israeli cities if provoked failed to raise Brent prices through a risk premium.

The euro strengthened against the dollar on Friday as Cyprus lawmakers sought to debate the legislation that would enable the EU to supply the necessary bailout funds, but the announcement that two Libyan oil fields were shut failed to create a rally in Brent which carried on riding the wave of uncertainty rather than responding to fundamentals. At the close of the week, WTI was at $93.7 and Brent at $107.7, with the Brent-WTI premium narrowing by -$2.3 to $14. Some of the price differential likely came from improved transportation in the US, with fundamentals gradually changing in the background of headline news.

Week Ahead

Monday provides the deadline for Cyprus to raise the necessary funds to secure the EU bailout, and failure to do so will result in withdrawal of emergency liquidity support from the ECB for Cyrprus’ beleaguered banks. Under such a situation, the country’s two largest banks will go under and likely take the country with, if no other help is found. Currently there seems hope that Cyprus’ lawmakers will agree on a depositor tax specifically aimed at raising those with the most funds deposited, while Russia continues to have a huge interest in the situation.

As the graph bellows shows, Brent has been trending downwards for weeks now, and while analysts will at some point expect a bottom for Brent prices, the result of the Cyprus vote will likely dictate whether that will be this week or now. If the vote fails, large falls on Monday are likely, whereas if the vote succeeds Brent will likely bounce back up and may begin following WTI in a similar band-trading pattern as has been experienced by the US blend. Importantly we can note that Brent is now approaching its price level last seen before positive economic signs and geopolitical tensions really heated up. Hence based on this, a higher price is likely if Europe doesn't explode.


Wednesday, 20 March 2013

Weekly WTI Crude Oil Inventory Analysis: EIA release of 20th March


Weekly WTI Crude Oil Inventory Analysis: EIA release of 20th March

Summary of today’s release: last weeks’ change in Crude Inventories figures:

API: -0.4mb
EIA Consensus:  +2mb
EIA actual: -1.3mb

US crude inventories dropped by a surprise -1.3mb last week, against a consensus forecast for a rise of 2mb. The fall was a result of a -2.7mb drop on the West coast, which is often discounted from US models due to its isolation from the rest of the country in terms of oil transportation. Without this drop, inventories actually rose.

The Breakdown

While a fall in West Coast stocks caused the positive headline number, inventories at Cushing also declined for the second week running. With new pipelines coming in to place next quarter (See Seaway No Solution), signs stocks are already dropping provide a bullish view for the market. Gulf coast stocks continued to rise, which is normal for this time of year, although EIA watchers should continue to observe the region to watch out for a possible supply glut transfer from Cushing to the Gulf coast.

US production dropped slightly, and as the production chart below shows the trend has certainly slowed in the last month. The production change can produce headline effects if the increase in large, and so such a sign provided support for crude fundamentals. Likewise refineries ramped up their through-put and utilisation which could be the start of the spring production upturn. Such a thought was given support by the sixth week of gasoline stock withdrawal, providing room for absorption of further future production.


While refineries may have increased their demand, total crude product and in particular gasoline demand did fall. The time series is quite variable, but may nevertheless spook some traders given demand that low had not been seen since early January. On the other hand support for US crudes was provided by imports dropping, and as the chart below shows, the 12-week MA for this series is clearly on a downward trend, reaching lower and lower lows.


How Markets Reacted

The individual market reaction to this release is hard to pin point, given the strong market reaction to the euro area situation in Cyprus as well as the announcement by the Federal Reserve today that the monetary easing program will continue. Overall, the bearish components of rising stocks in a non-West Coast sense as well as a fall in product demand did not seem to detract from otherwise bullish sentiment in afternoon trading, although WTI then dropped off again in the late US afternoon session, ending the US trading session -0.1% down.

Next week’s release

The main point to watch next week will be Cushing supplies, as the completion of the Longhorn pipeline reversal should mean some crude deliveries to the Gulf Coast can bypass the mid-West hub, which would buoy WTI markets and possibly result in a large narrowing of the Brent-WTI premium. At the same time look out for a possible correction next week if we see two consecutive weeks of gasoline demand falls. Indeed, such a result is possible because of the cold weather and snow in the North East Coast of USA this week, which could reduce demand there.

Sunday, 17 March 2013

Weekly Crude and WTI Oil Market Summary: Brent-WTI premium drops further


11/Mar/13 - 15/Mar/13

As forecast in last week’s summary, the diverging trends between Brent and WTI continued to be seen this week and the Brent-WTI premium dropped as expected. The premium, which had been $18.9 at last weeks’ close, fell by $2.6 to reach $16.3 by the end of European trading on Friday. While two late days of gains pared an initial three consecutive days of losses, the European grade nevertheless fell -1% on the week, while WTI increased 1.6%.

Weekly Summary


WTI opened in Europe on Monday at $91.8, slightly down in Asia trading from the Friday close of $92. Brent meanwhile had dropped $1 overnight in Asia and continued to be hit by negative sentiment, losing a further -0.2%. The cause of this negative sentiment was Chinese economic data, with the combination of higher-than-expected inflation and lower than expected industrial output growth implying a situation which meant not only was China slowing, but that any attempt at stimulus could result in inflationary problems. The USD meanwhile fell against the euro, possibly only due to a retracement from Friday’s gains in the wake of the positive labour news, but this had the effect of increasing investment flows into the US grade, which by the end of European trading had risen 0.4%.

Two major reports were released on Tuesday; the EIA and OPEC monthly releases. While the former cut its world oil demand forecasts, the latter also cut its growth forecasts for the US and euro zone; the resulting negative sentiment led to a further Brent price cut of -0.4%. Positive news came from China where implied oil demand rose in February, but this was offset by reports that South Korea will be closing a tax loophole in April which will result in less demand for Brent. WTI meanwhile carried on its upward trend, gaining a further 0.4%. Analysts suggest some of this gain would have been further speculation on the Brent-WTI narrowing over the coming weeks, with the Longhorn pipeline reversal  given East Texan crude a route to refiners that will avoid Cushing (see Seaway no Solution). After European trading, the API report showed inventories had decreased by 1.4 mb, against an expectation for the EIA report of a 2.3m rise, which had further positive effect on the WTI blend in US trading.

Despite the drop in inventories shown by the API report, the government-backed EIA survey showed stocks actually increased more than the surveyed 2.3m rise, coming in at a gain of 2.6mb. While overall stocks increased, supplies at Cushing dropped which improved the belief that logistical bottlenecks, the main cause of low WTI prices, are being overcome. This fine detail pared losses for WTI, but the grade nevertheless fell -0.2% due to the inventory increase. On top of this news, the IEA released its monthly report which confirmed a 2013 oil demand decrease as also forecast by the EIA. The international agency also reported that OPEC production had increased in February, with output in Iraq in particular growing strongly. Adding to supply issues was further negative sentiment in the euro area where industrial production fell 0.4% m/m. The combination of a weaker European demand picture and increasing OPEC supplies led to further speculation that the Brent-WTI premium will fall. Indeed the grades closed at their lowest difference since January at $15.7, caused by a larger fall in Brent of -0.9%.

Brent finally saw some respite on Thursday, with both grades gaining strongly after US jobs numbers came in positive for the third consecutive week and the oil risk premium increased after US President Obama confirmed military force remained an option to prevent Iran gaining nuclear capability. Additionally in the US, a bipartisan group introduced a bill into the Senate that would give Congress the power to approve the Keystone XL pipeline without Presidential approval. While the technicalities and legality of the bill could be called into question, the pressure from the action should nevertheless prompt Obama to make a decision sooner rather than later, with the majority believing the pipeline will be approved. Such a decision could further alleviate supply gluts. Oil also received a boost from a further easing of the USD, and by the end of European trading WTI was up 0.8% and Brent 0.9%.

Brent continued to outpace WTI on Friday, with the European blend gaining 0.5% veruss at 0.2% rise in WTI. The positive momentum came despite a slip in US consumer confidence. Rather, a CPI release showing inflation is contained reduced the chance of the Fed pulling back its monetary easing program, thus leading to a further depreciation of the USD and therefore flows into oil as it became a more attractive investment, particular with both short and long term forecasts for US oil prices to increase. By the end of European trading, WTI had reached $93.5, a rise of $1.5 from its previous close, and Brent $109.8, down $1.1. The last two days of Brent strength resulted in the Brent-WTI premium widening, but the premium nevertheless fell to its lowest weekly close since January 18th.

Week Ahead

Data-wise, the German ZEW on Tuesday could dictate European economic sentiment, while US housing starts could prove positive for markets given the current consensus of a larger rise than last month.  The annual UK budget will be announced on Wednesday with its possible market implications, and later in the afternoon the Fed will meet for its rate decision, with market participants continuing to look for any clues regarding how long quantitative easing will continue. A fourth consecutive week of increasing jobless claims could combine with positive existing home sales data and an improving business conditions index on Thursday.

Charts-wise (see below): On the daily chart Brent formed a reversal pattern on Thursday and Friday, with the so-called tweezers bottoms on Wednesday and Thursday leading to a “three inside up” when including the week-end. If Brent strength continues on Monday, a “three white soldiers” pattern will have formed, implying an upward trend is beginning. WTI meanwhile continues to trend upward, and strength indicators such as the RSI indicate this trend could continue, showing positive momentum but not signalling the grade is anywhere near overbought. WHat's more, the crossover of the 10 & 20 day MA could occur on Monday, which has previously served as a good buy signal. Hence, technical indicators suggest WTI should continue upward at least until its prior support/resistance area of $94.6.


While a positive Monday for Brent could suggest this week’s losses were the end of a downward trend, it’s hard to see Brent gaining much strength in the face of increasing output and with economic growth signs remaining tentative in Europe and Asia. Having said this, a positive ZEW on Tuesday could provide some short-term support. While such an outcome could prevent any serious change in the Brent-WTI spread for the next couple of weeks until confirmation of pipeline effects come into being, if WTI manages to breach its $94.6 resistance level then it could continue to hurtle upwards until the $97-$98 range. Hence I expect to see either a generally stable or slightly decreasing Brent-WTI premium this week.